A Data Pipeline is a Materialized View
Say you run an online book store and want to build a data pipeline that figures out who the top-selling authors are. Logically, the input to the pipeline is a log of every individual book purchase on the store for all time, along with details about each book like who authored it. And the output is a list of the top-selling authors per month.
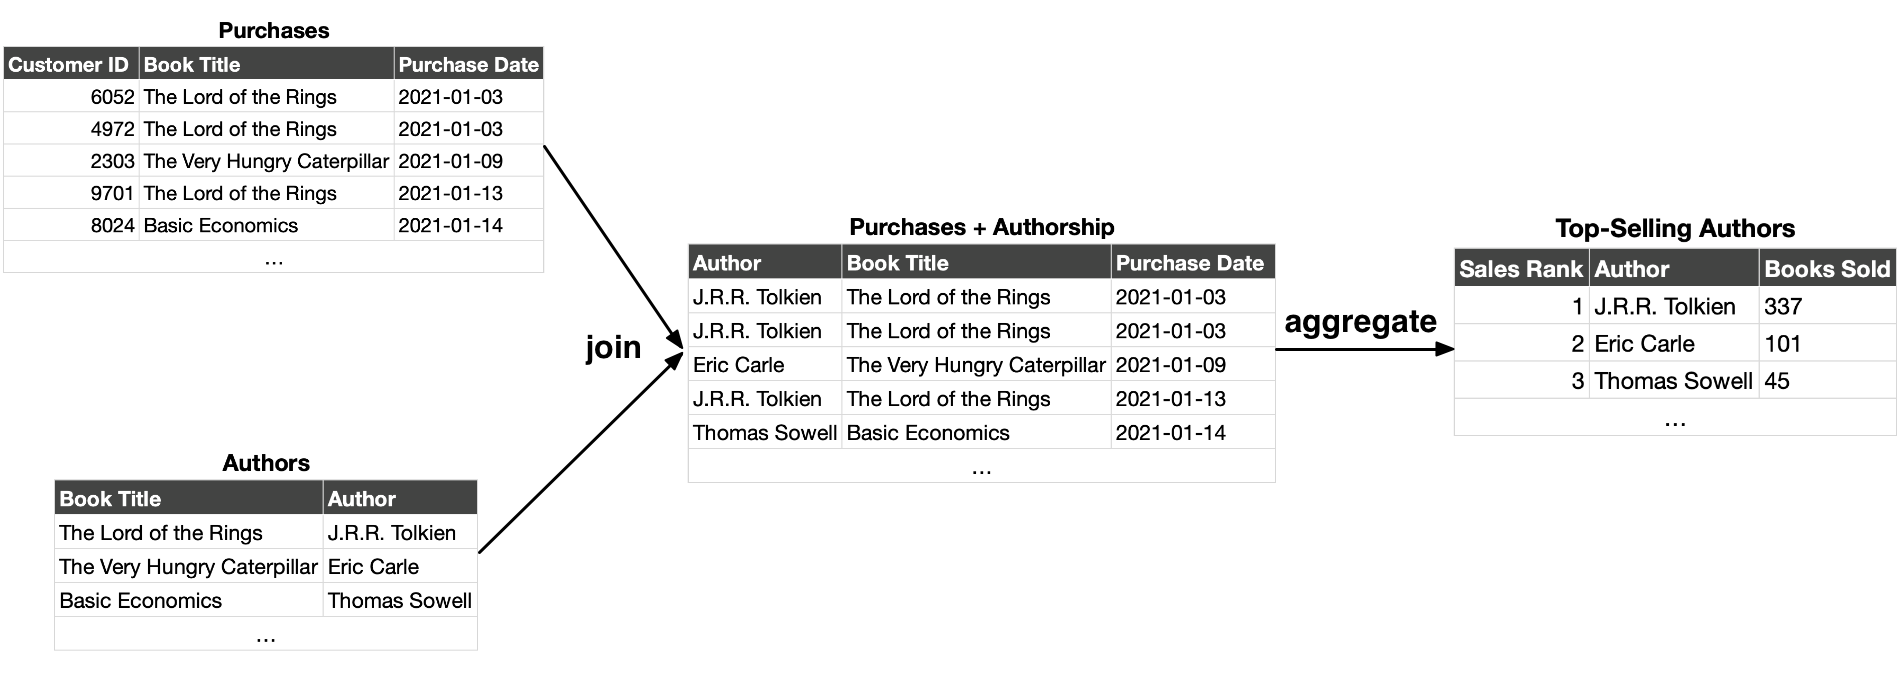
The output of this data pipeline is a function of the input. In other words, the output is derived from the input by running the input through the pipeline.

This is an important characteristic of the output. As long as the input data and pipeline transformations (i.e. the pipeline code) are preserved, the output can always be recreated. The input data is primary; if lost, it cannot be replaced. The output data, along with any intermediate stages in the pipeline, are derivative; they can always be recreated from the primary data using the pipeline.
The Logical View
Let’s represent our hypothetical “Top-Selling Authors” pipeline as a directed graph, where the nodes represent datasets and the edges represent transformations of those datasets. Furthermore, let’s color each dataset in the graph based on whether it’s primary or derivative.
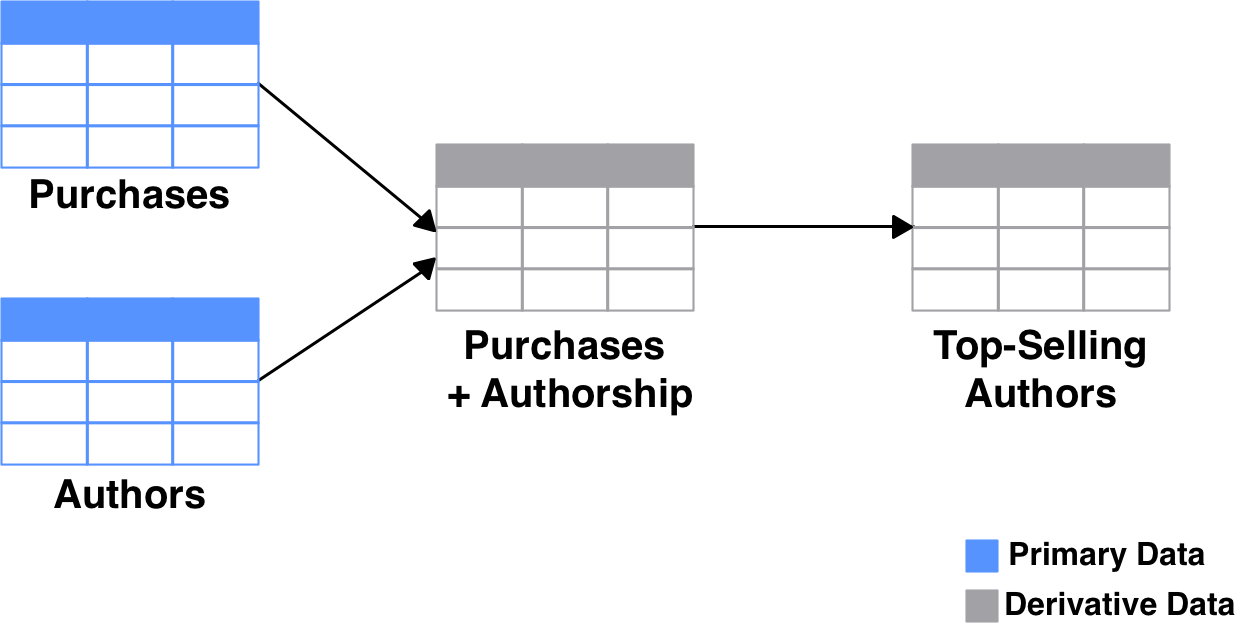
Most data pipelines, if you zoom out far enough, look something like this. You have some source data; it gets sliced, diced, and combined in various ways to produce some outputs. If someone were to wipe out all the derived data in this pipeline, you’d be able to regenerate it without any data loss. The pipeline could include any number of arbitrary steps, like copying files from an FTP share, or scraping data from a web page. It doesn’t matter as long as the pipeline produces the same output when given the same input.
Any time someone queries the output of the pipeline, it’s logically equivalent to them running the entire pipeline on the source data to get the output they’re looking for. In this way, a pipeline is a view into the source data.
Materializing the View
Of course, data pipelines don’t work this way in practice. It would be a waste of resources and a long wait for users if every query triggered a series of computations stretching all the way back to the primary data. When you ask for this month’s top-selling authors, you expect a quick response.
Hence, the typical real-world pipeline materializes its output, and often also several of the intermediate datasets required to produce that final output. Materializing a dataset simply means saving it to persistent storage, as opposed to repeatedly computing it on the fly. So when you ask for that list of authors, whatever system answering your query can start from the closest materialized dataset, as opposed to starting at the source or primary data.
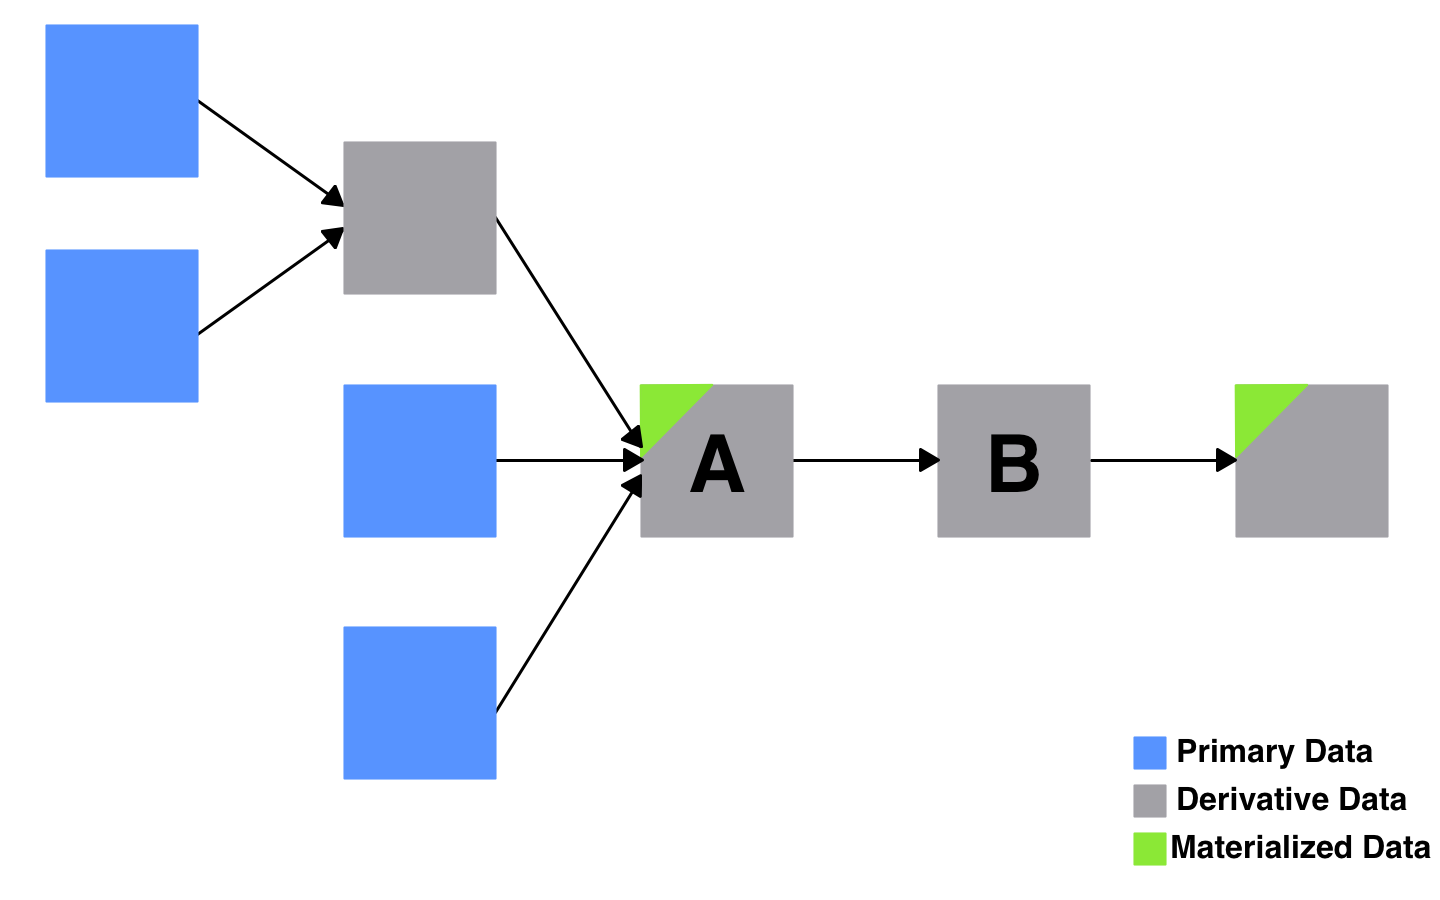
So we’ve turned our view into a materialized view. “View” represents the logical transformations expressed in the pipeline. “Materialized” represents the fact that we cache the output of the pipeline, and perhaps also some of the intermediate steps. A complex set of interdependent data pipelines can be conceptualized in this way, as a graph of materialized views.
Note that this concept can be applied very broadly, and not just to what we think of as “normal” data pipelines:
- A traditional web cache alleviates read traffic from the primary database, which is the source of truth. The cache is derivative and can be regenerated from the database at any time. The data in the cache is materialized so that incoming queries do not need to go all the way back to the database to get an answer.
- A build system compiles or assembles source code into artifacts like executables or test reports. The artifacts are derivative, whereas the source code is primary. When you run a program over and over, you reuse the artifacts output by your build system, as opposed to recompiling them from source every time.
Updating a Materialized View
Materializing the output, though a practical necessity for most pipelines, adds an administrative cost. When the source data changes, the materialized views need to be updated. Otherwise, the data you get from the view will be stale.
To update a materialized view, there are two high-level properties you typically care about: the update trigger, and the update granularity. The former affects the freshness of your output, which impacts end-users of the data, and the latter affects the performance of your update process, which impacts the engineers or operators responsible for that process.
Update Trigger
The update trigger is the event that prompts a refresh of the materialized view—e.g. by running your pipeline against the latest source data.
That event may be a file landing in a shared drive, or some data arriving on an event stream, or another pipeline completing. For some pipelines, the update trigger may just be a certain time of day, in which case it might be more useful to talk about the update frequency rather than trigger.
A typical batch pipeline, for example, might run on a daily or hourly cadence, whereas a streaming pipeline may run every few seconds or minutes, or whenever a new event is delivered via some sort of event stream. Whenever the pipeline runs, it updates its output, and the whole process can be viewed as a refresh of the materialized view.
Update Granularity
The update granularity refers to how much of the materialized view needs to be modified to account for the latest changes to the source data.
A common update granularity is the full refresh. No matter how small or large the change to the source data, when the pipeline runs it throws away the entire output table and rebuilds it from scratch.
A more sophisticated pipeline might rebuild only a subset of the table, like a date partition. And an extremely precise pipeline may know how to update exactly the output rows that are impacted by the latest changes to the source data.
The update trigger and granularity are independent. You can have a pipeline that runs every second and does a full refresh of its output, and you can have a pipeline that runs once a day but carefully updates only the rows that it needs to.
Typical Examples
Let’s explore these two properties a bit using our example pipeline that computes the top-selling authors of the month.
The Daily Batch Update
Every night at 1 a.m., an automated process looks for a dump of the latest purchases from the previous day. The dump is a compressed CSV file.
The update process uses this dump to recompute the month’s sales numbers for all authors. It replaces the entire output table with all-new calculations for all authors. Many of the authors’ numbers may not have changed since the last update (because they had no new sales in that time period), but they all get recomputed nonetheless.
This is a very typical example of a batch pipeline. It has a scheduled update trigger at 1 a.m. every night, and an update granularity of the entire output.
The Live-Updating Table
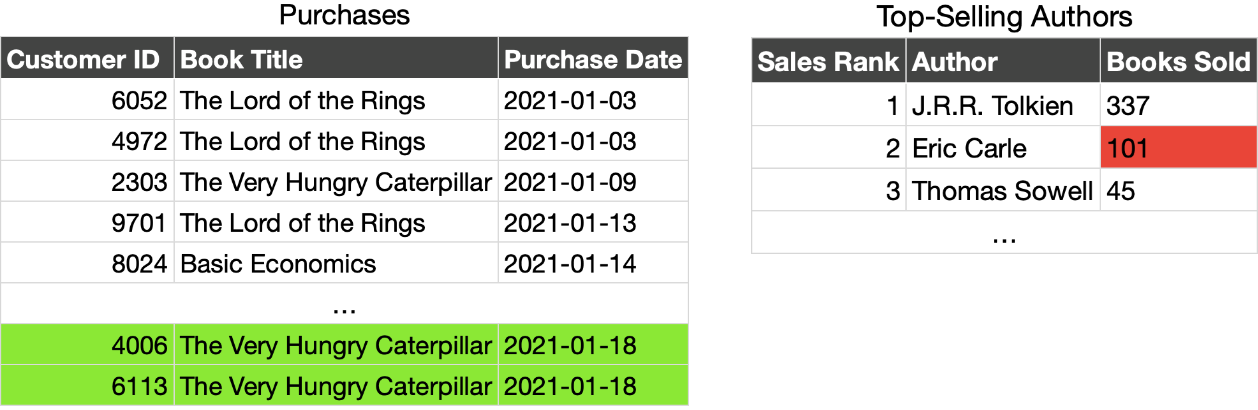
In this version of our top-selling authors pipeline, individual purchases are streamed in as they happen, via a stream processor like Apache Kafka. Every purchase on this stream triggers an update to the calculation of top-selling authors.
The update process uses each individual purchase to incrementally recompute the sales total for the relevant author. If an author has no new sales over a given span of updates, their sales total is not recomputed (though their rank in the top-selling authors may need to be updated).
This is an example of a precise streaming pipeline. The update trigger is the purchase event that is streamed in, and the update granularity is the sales total for a single author.
The Declarative Data Lake
We previously discussed the idea of conceptualizing your data lake as a database. And here we’ve shown how you can conceptualize your data pipelines as materialized views.
But what if we could take this idea further than just as a conceptual tool? What if you could actually implement your data pipelines as a graph of materialized views?
Taken far enough, the promise of such an idea would be to build a declarative data lake, where the code that manages the lake focuses more on defining what the datasets are and less on how to mechanically build or update them.
Two relatively new projects express aspects of this vision in clear but different ways, and they merit some discussion here: dbt and Materialize.
dbt: Pipelines as Batch-Updated SQL Queries
The core of dbt is an engine for building a graph of SQL queries. Parts of any given query can be generated dynamically using a templating language (Jinja), and queries can reference other queries.
Every query has a configured materialization strategy, which defines whether the results of the query are generated ahead of time, and if so, how they are stored and updated.
If the results are materialized, they can be updated with a full refresh or incrementally, though there are some restrictions on what kinds of updates can be done incrementally. Updates are typically triggered on a schedule.
Materialize: Pipelines as Live-Updated Materialized Views
Materialize is an engine for building live, incrementally updated materialized views from streaming sources like Apache Kafka. A view can reference other live-updated views, as well as fixed tables.
The primary interface for creating these views is plain and elegant: A CREATE MATERIALIZED VIEW SQL statement.
Conceptually, this is roughly the same statement that is available in traditional relational databases. Materialize’s implementation however, allows for very efficient incremental updates against very flexible and expressive queries. Materialize’s capabilities are based on relatively new research done by its creators.
Conclusion
The ideas presented in this post are not new. But materialized views never saw widespread adoption as a primary tool for building data pipelines, likely due to their limitations and ties to relational database technologies. Perhaps with this new wave of tools like dbt and Materialize we’ll see materialized views used more heavily as a primary building block in the typical data pipeline.
Regardless of whether we see that kind of broad change, materialized views are still a useful design tool for conceptualizing what we are doing when we build data pipelines.
Get clear on what data is primary and what is derivative. Map your pipeline to the concept of a graph of transformations with materialized, intermediate datasets, each with a specific update trigger and update granularity.
The exercise should help bring some conceptual order to even the messiest pipelines.
Read the discussion about this post on Hacker News.